


Dashboard
The Dashboard displays an analysis of the schedule in five charts and tables:-
Logic
Progress
Gantt
Start Dangles
Finish Dangles
The Dashboard is initially calculated when the project is created, however, because of the time taken to recalculate on large projects the Dashboard is only updated when requested by the user (see Popup Menu) or when the project is saved. This means that when the project is reloaded the displayed Dashboard is up to date.
If the 'Title' of the chart or table is greyed out then the currently displayed chart or table is not up to date.
The Dashboard display can be shown or hidden by checking or unchecking 'Show Dashboard' on the View Menu.
The individual charts and tables of the Dashboard can be shown or hidden by checking or unchecking 'Show Logic', 'Show Progress', 'Show Gantt', 'Show Start Dangles' and 'Show End Dangles' on the View/Show Dashboard sub menu.
As the individual charts and tables of the Dashboard are hidden, the size of the remaining charts and tables are adjusted to fill the entire Dashboard.
Logic Chart
The Logic Chart comprises of 3 section

Task Chart
The Tasks chart shows the number of each Task Type contained in the schedule is and is presented in Column chart format.
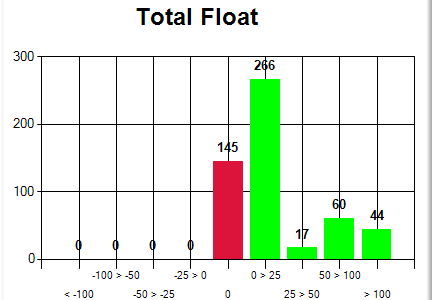
Total Float Chart
The
Total Float chart shows the number of each Task within a band of
Total Float values is and is presented in Column chart format.
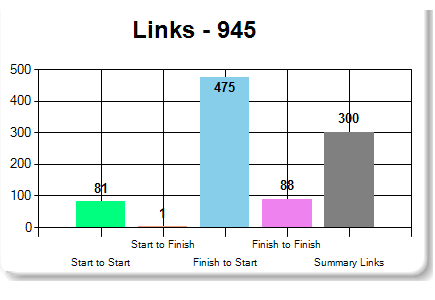
Links Chart
The Links chart shows the number of each Link Type contained in the schedule is and is presented in Column chart format.
Progress Chart

Gantt Chart

The Progress chart is calculated by plotting the schedule of Planned/Completed/Remaining Durations against time.
It compares the Baseline against the current Early and Late Start envelope taking into account any completed work and is presented in Line chart format.
Start and Finish Milestones and Summary Tasks are not included in the calculations as the former have zero durations and the latter would effectively add some of the durations twice.
The Gantt Chart shows a short term programme of the Tasks to be carried out, starting from 'Time Now'.
The period of the programme is dependent on the Time Units of the project.
A project with Time Units of 'Day' covers a period of 28 Days.
A project with Time Units of 'Hour' covers a period of 24 Hours.
A project with Time Units of 'Minute' covers a period of 30 Minutes.
It is not always possible to show the full chart on the screen so it can be scrolled horizontally and vertically to reveal any hidden Tasks and Bars.
The full Gantt Chart can also be printed using the button adjacent to the title.
Start Dangles Table

Finish Dangles Table

The Start Dangles table lists any Task which does not have a Link that connects with the start of the Task.
This table is provided to allow the user to perform any 'housekeeping' to tidy up the schedule.
As there can be more Start Dangles than can be displayed on the Dashboard, the table can be scrolled vertically to reveal any remaining Start Dangles.
The full Start Dangles table can also be printed for reference using the button adjacent to the title.
It is not a requirement of ChainLink to have only one Start Dangle as it is perfectly capable of handling partial schedules imported into it.
The user should be aware that if the 'All Tasks' Schedule Type is selected then the Start Dangle Tasks which do not have an Imposed Start Date will be shown starting on the Time Now Date.
The Finish Dangles table lists any Task which does not have a Link that connects with the finish of the Task.
This table is provided to allow the user to perform any 'housekeeping' to tidy up the schedule.
As there can be more Finish Dangles than can be displayed on the Dashboard, the table can be scrolled vertically to reveal any remaining Finished Dangles.
The full Finish Dangles table can also be printed for reference using the button adjacent to the title.
It is not a requirement of ChainLink to have only one Finish Dangle as it is perfectly capable of handling partial schedules imported into it.
The user should be aware that if the 'All Tasks' Schedule Type is selected then the Finish Dangle Tasks which do not have an Imposed Finish Date will be shown finishing on the Completion Date.
Popup Menu

The Popup Menu is displayed by right mouse clicking on any of the charts or tables.
The Popup Menu allows the user to individually update any of the charts and tables or save the Dashboard to file for reporting purposes.
A check mark adjacent to the menu item indicates that the currently displayed chart or table is up to date.
If no check mark is displayed, the currently displayed chart or table is not up to date.